Generating scenario tables
Introduction
In financial modelling, and in particular the high pressure environment of transaction modelling it is very useful to be able to generate Scenarios efficiently, in a controlled environment. This post covers two main methods both of which require an integrated scenario manager – a 1D Data Table and using VBA to loop through each scenario and record the results. The calculation of output (from input) is intentionally simple – you need to visualise your own model feeding your own calculations.
The visual basic included herein is intended to be for demonstration only but is sufficiently robust to handle changes in the underlying spreadsheet and to inform the user on progress via the Status Bar and also a finishing Message.
Download note: For security purposes the Excel file is saved with Macros disabled, once downloaded you will need to Save As a .XLSM file before the macros will work. To view the code open the VBA editor ALT+F11.
Download Workbook Training Courses
1. Data Table of Scenarios
Data-tables are a native feature of Excel and an incredibly powerful way of adding a ‘live’ dimension or two to your analysis. I champion Data Tables when I prepare professional financial analysis for Project Finance development teams, boards and senior executives – although I do it mindfully appreciating the restrictions. Over the years I have found they have a mixed reputation; either for slowing models down or not being transparent and/or overcomplicating output – like most tools in your workshop if they are not used and maintained properly they will yield undesirable results.
This tutorial, along with the accompanying downloadable spreadsheet demonstrates how you can use a 1D Data Table to show key outputs for “all scenarios all of the time” – an amazing way of spotting errors and understanding the economics of your project rather than waiting until scenarios are generated, often at the last minute and under pressure – this is where errors creep in!
In the image below you can see how the NPV and Distributions for all scenarios are displayed, if anything changes in the model all of these values will update without you doing anything – super powerful! However – this comes at a price, each row of the table represents the whole model being calculated so a model that took 1 second to calculate, now takes 15 seconds.
.PNG.aspx)
2. Data Table of scenarios - controlled with a macro
To manage the computational load is to only have the data table ‘live’ when you need it. There are two ways to do this:
- Set the Calculation Mode to “Automatic (Except Data Tables); or
- Create a Macro which can build / dismantle this table at will.
I prefer Option 2 - generate project finance scenarios using a Data Table but stay in control.
Here is a quick list of the steps to create the Data Table.
- Build the infrastructure required (Column numbers down, key output (grey) going across)
- Highlight the area best described as Table.Outer in the next part
- Navigate to Data > What-if Analysis > Data Table
- Ignore the first field (Row Input)
- Populate second field (Column input) as = Live Scenario selector
- You may need to F9 to force a calculate.
Then create two buttons, labelled as:
- Build table
- Dismantle table
.png.aspx)
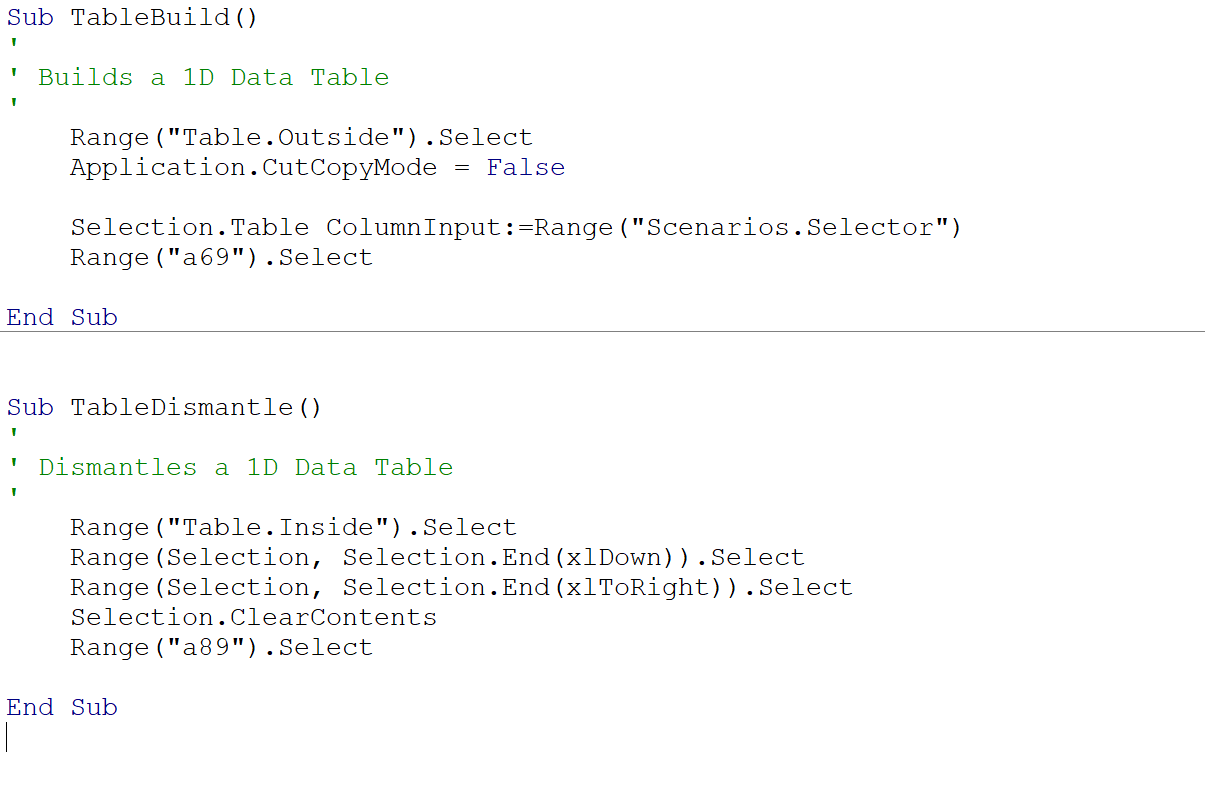
TheVBA code for the two macros, is straightforward, you will find it in the downloadable Workbook.

3. Scenario table using Visual Basic
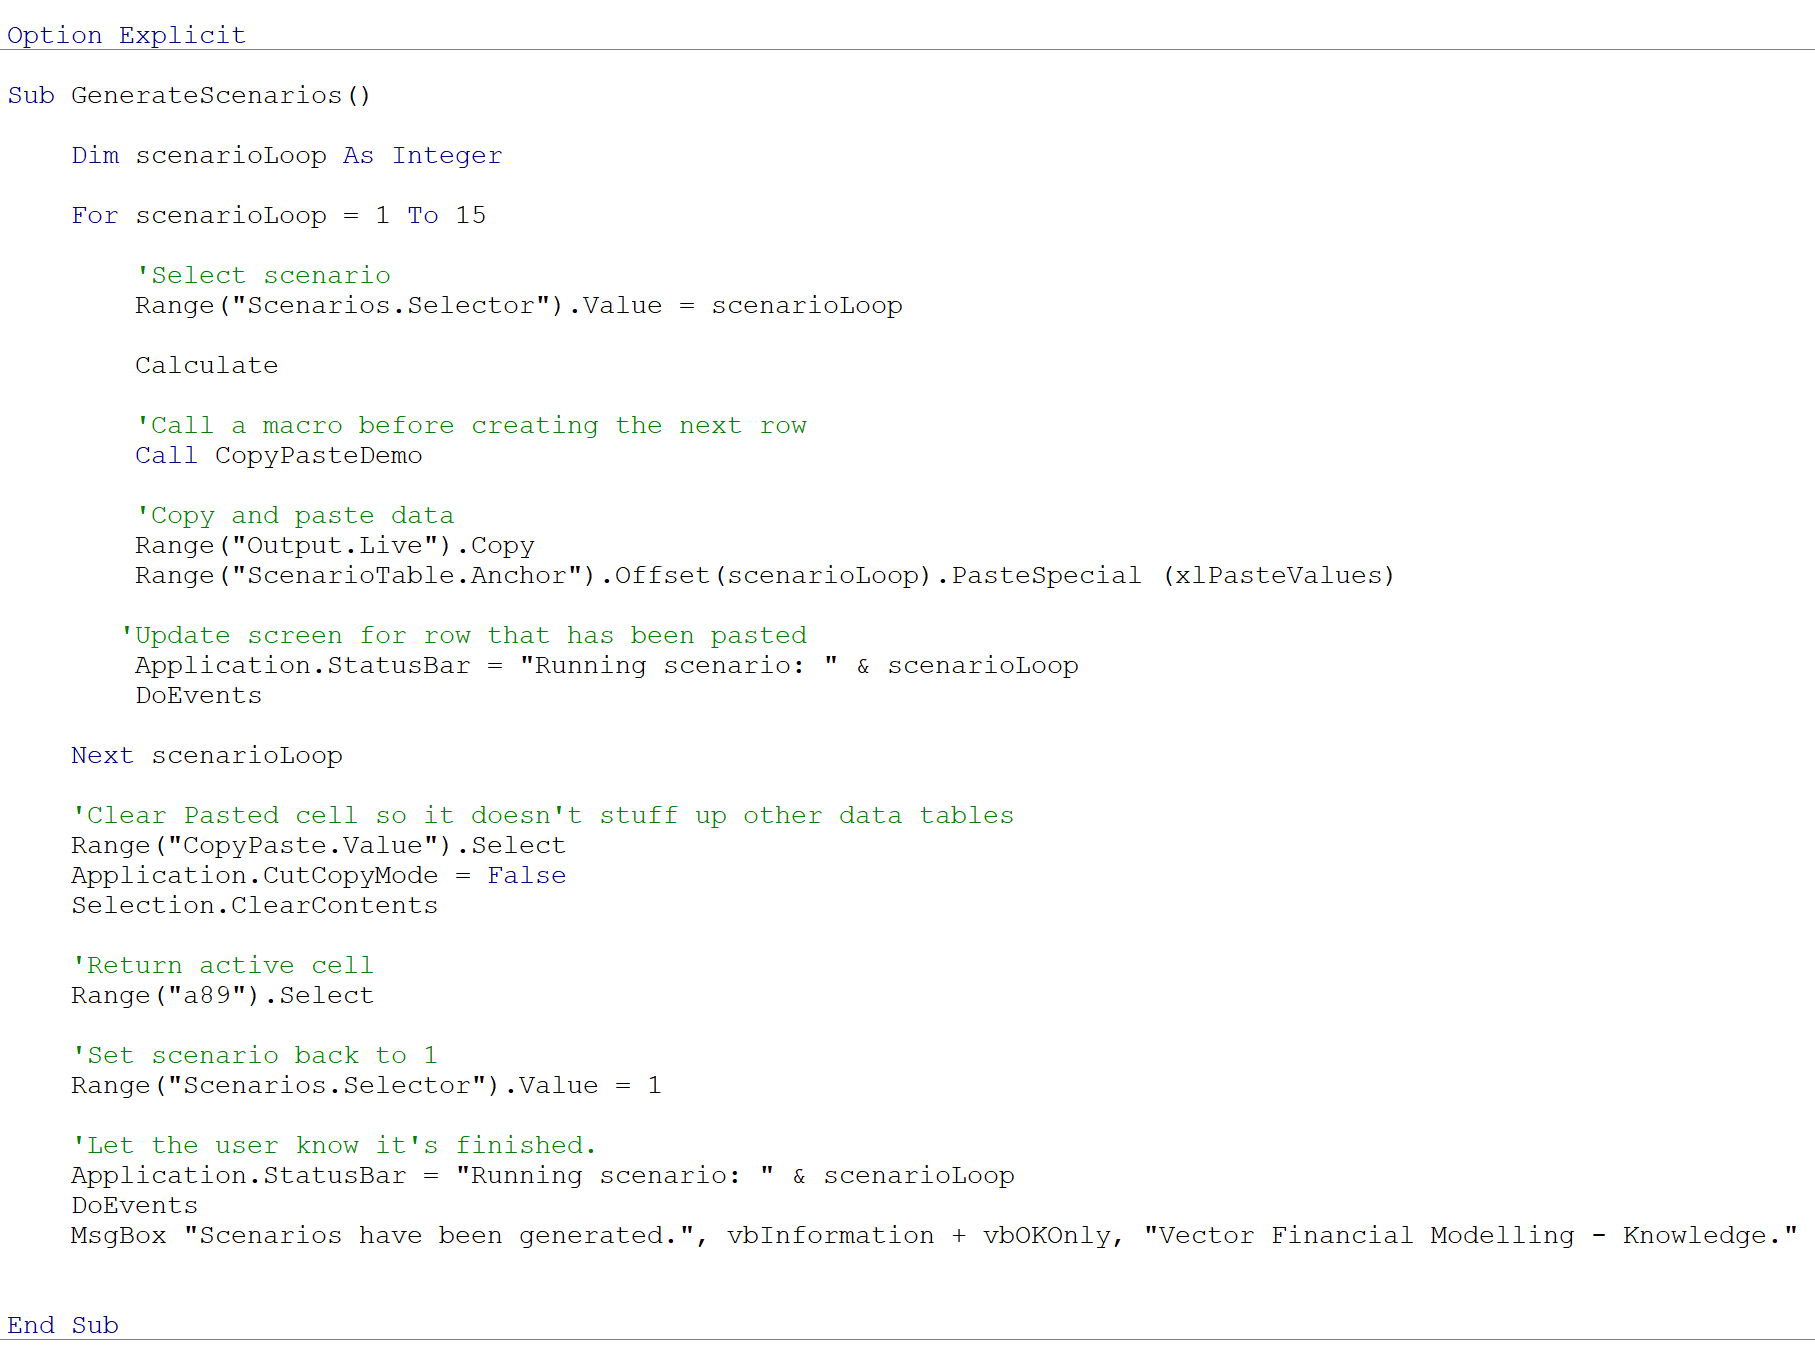
A downside of Data Table is that there is no option for executing a routine in between generating each row. It is fairly common that a macro may need to run to size a facility, sculpt a repayment facility or solve for a specific return. In this instance we leave Data Tables and create VB script to essentially automate the task of cycling through each Scenario, copying and pasting the value alongside the corresponding scenario name / number. In full control of what is being calculated it is then straightforward to call another macro say a cut-n-paste macro (for the purpose of demonstration).
The important aspects of this code are
- Lines of code are annotated
- Important references to the spreadsheet are via Range Names
- The User is kept up to date with progress via StatusBar messages

Summary
Build robust scenarios into your model and in doing so take one step closer to lower organisational model risk through making financial models easier to quickly check, explain, edit and audit. This approach is covered extensively in Vector’s Financial Modelling courses. If you found this helpful and would like to learn about other aspects of Project Finance Analysis or Mastering Financial Modelling then you would love our in-house and 1-1 training courses. Give us a call to find out more.